- Analisis
- Analisis Teknikal
CAD/JPY Analisis Teknikal - CAD/JPY Berniaga: 2021-06-08
CAD/JPY Ringkasan Analisis Teknikal
Below 89,7
Sell Stop
Above 91,3
Stop Loss
| Penunjuk | Isyarat |
| RSI | Sell |
| MACD | Sell |
| MA(200) | berkecuali |
| Fractals | berkecuali |
| Parabolic SAR | Buy |
| Bollinger Bands | berkecuali |
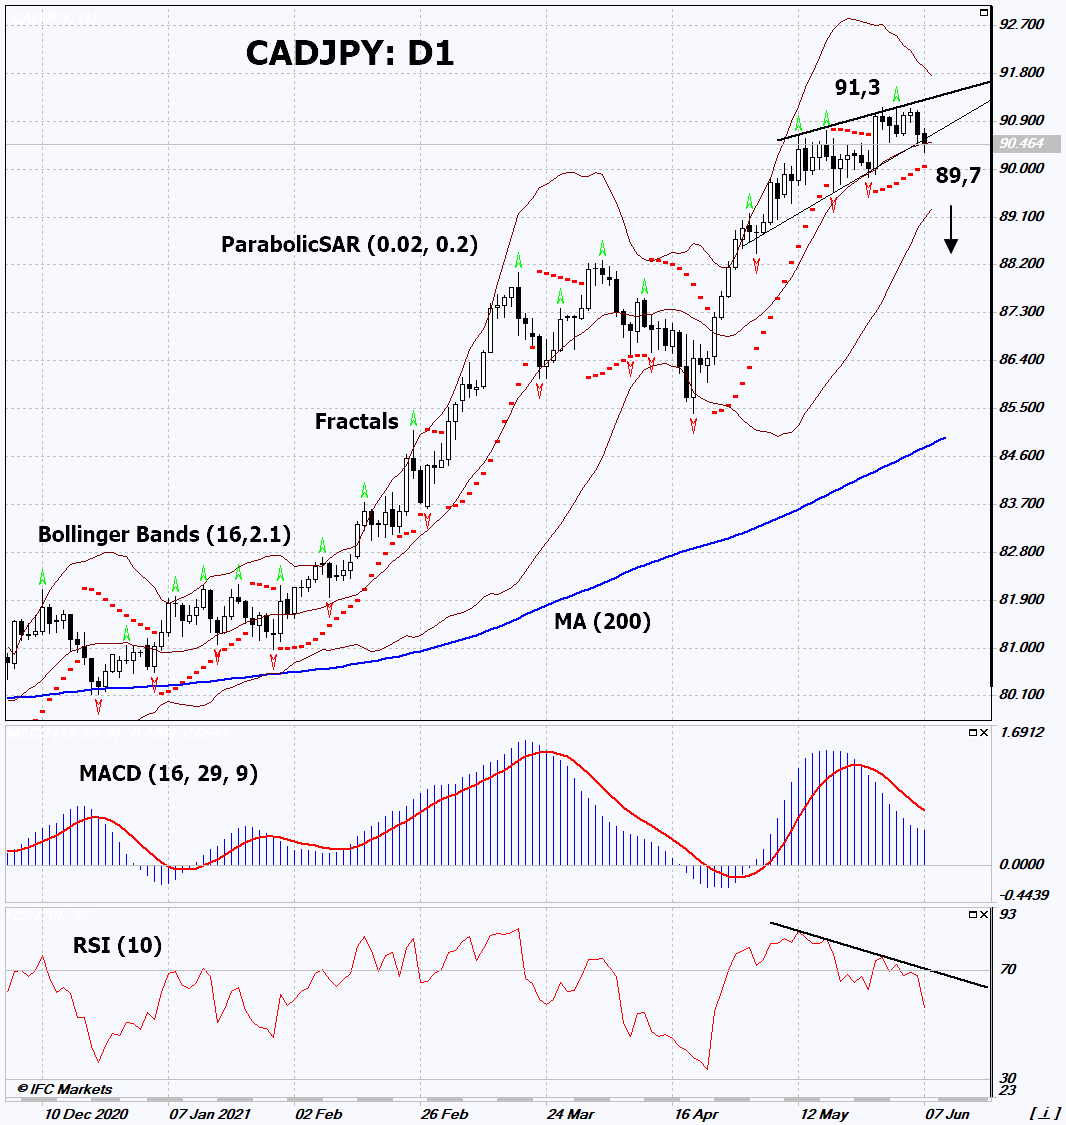
CAD/JPY Analisis carta
CAD/JPY Analisis teknikal
On the daily timeframe, CADJPY: D1 is correcting downward and has broken down the support line of the triangle and the short-term uptrend. A number of technical analysis indicators have formed signals for further decline. We do not exclude a bearish movement if CADJPY falls below the last lower fractal and the Parabolic signal: 89.7. This level can be used as an entry point. The initial risk limitation is possible above the last fractal high and high since January 2018: 91.3. After opening a pending order, move the stop to the next fractal maximum following the Bollinger and Parabolic signals. Thus, we change the potential profit/loss ratio in our favor. The most cautious traders, after making a deal, can go to the four-hour chart and set a stop-loss, moving it in the direction of movement. If the price overcomes the stop level (91.3) without activating the order (89.7), it is recommended to delete the order: there are internal changes in the market that were not taken into account.
Analisis Asas bagi Forex - CAD/JPY
Economic activity has increased in Japan. Will CADJPY quotes go down?
A downward movement signifies a weaker Canadian dollar and a stronger Japanese yen. On Monday, June 7, Japan released two PMIs, which reached pre-covid levels. The preliminary Leading Composite for April exceeded the forecast and amounted to 103 points. If it receives confirmation in the 2nd assessment, then it will be the maximum from September 2018, before the coronavirus epidemic. Also on Monday, the Coincident Index for April was released in Japan. It amounted to 95.5 points, which is the highest since February 2020. On June 8, Japan will release its final Q1 GDP. It may affect the yen rate if it differs greatly from its initial estimate (-1.3%) in quarterly terms and (-5.1%) in annual terms. According to forecasts, the fall in GDP will be less than the 1st estimate and amount to (-4.8%). For the Canadian dollar, weak data on the labor market for May may become a negative factor. Unemployment in Canada increased to 8.2% from 8.1%. The number of new jobs fell more than expected. In addition, the outlined decline in oil prices due to the reduction in oil imports to China in May may become a negative factor for the Canadian dollar. On June 9, a meeting of the Bank of Canada will take place. A rate change of 0.25% is not expected, but it may affect the dynamics of the Canadian dollar.
Perhatian:
Kajian berikut adalah berdasarkan maklumat kognitif dan diterbitkan secara percuma. Semua maklumat, terkandung dalam semakan semasa, diperolehi dari sumber umum, diakui sebagai tidak tepat sepenuhnya. Oleh yang demikian tidak dijamin, maklumat yang dipaparkan adalah tepat dan lengkap sepenuhnya. Ulasan kemudian tidak dikemaskini. Segala maklumat pada setiap ulasan, seperti ramalan, petunjuk, carta dan seumpama dengannya, hanya disertakan bagi tujuaan rujukan, dan bukan sebagai nasihat kewangan atau cadangan. Kesemua teks dan sebahagian darinya, dan termasuk juga carta, sesama sekali tidak boleh digunakan sebagai cadangan untuk membuat sebarang transaksi untuk sebarang saham. Syarikat IFC Markets dan pekerjanya tidak akan bertanggungjawab di bawah mana-mana keadaan untuk segala tindakan yang diambil oleh sesiapa selepas atau semasa ulasan.


